
A simple guide to your first analysis.
Your first analysis, one step at a time. Start with a practice file, learn the workflow, then bring your own study data.
Practice data is synthetic. Uploading and saving a draft do not use analysis quota; starting a practice run uses one analysis, just like any other run.
Start a complete review with your team
Open Review projects. Set your PICOTT question and eligibility rules, then invite collaborators by email. Follow the stages: import reference exports, review duplicates, screen titles and full texts, extract data, assess risk of bias, and approve a dataset for R analysis. Two independent human reviewers are the default. AI suggestions are optional and remain editable.
Find a research topic
Open Meta-analysis opportunities to browse recent trials by specialty, journal and PubMed entry date. Open a study for its abstract and any administrator-reviewed research leads. Administrators maintain the library and schedule updates.
Bring the right data.
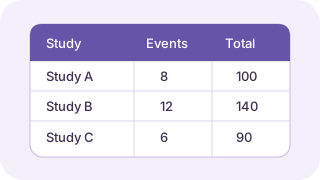
For a straightforward two-group comparison, give each study its own row and each outcome its own worksheet. Put descriptive column names in the first row. Upload a CSV or Excel file from New analysis.
Decide which studies, comparisons and outcomes belong together before pooling results. Check your protocol and risk-of-bias assessments. Repeated publications, overlapping participants and shared control groups need special care.
Which numbers do I need?
| Data type | Typical columns | Example outcome |
|---|---|---|
| Events in two groups | Study, event.e, n.e, event.c, n.c | People who recovered / everyone in each group |
| Measurements in two groups | Study, mean.e, sd.e, n.e, mean.c, sd.c, n.c | A measurement summarised by mean, standard deviation and group size |
“.e” identifies the treatment group and “.c” the comparison group. Do not put percentages in event-count columns. The upload illustration shows just one group; the downloadable example contains both.
What about other study types?
The data-type selector also supports one-group, diagnostic and network analyses. Their input and methodological requirements differ. Ask the administrator for help with those formats or with repeated studies, adjusted estimates and complex designs.
Only upload authorised study-level summaries. Do not include patient names, medical-record numbers or other patient identifiers.
Review, then run.
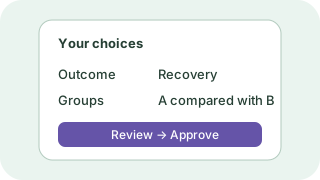
- Check the preview. Confirm study names, headings and numbers. Use “Are the column headings on the wrong row?” if needed.
- Choose your outcomes and data type. Automatic detection uses the workbook headings. You can choose a data type yourself and correct binary study/group column mappings.
- Use AI only if helpful. On the optional AI screen, “Suggest an analysis for me” shows the proposed method and columns. Choose “Yes, edit the AI suggestion” to make changes, or accept the choices to see your summary. You can also discard the suggestion or continue without AI.
- Review “Your analysis summary”. The guide shows one screen at a time. Check the method and outcomes, then answer “Does anything need editing?” Use “Yes, edit my choices” to go back without losing your work. “See all saved choices” shows additional settings.
- Confirm, then run. Check “No more edits” after reviewing the summary. Only then can you select “Run this analysis”. Changing your choices requires a fresh confirmation. The progress indicator shows the processing stage. You can leave and return through My analyses.
New analyses start with the existing frequentist method and automatic route detection. Saved methods are preserved on a rerun; simplifying the screen does not change earlier choices. AI suggestions do not use analysis quota, but have separate usage limits. R calculates all statistics.
Understand what came out.
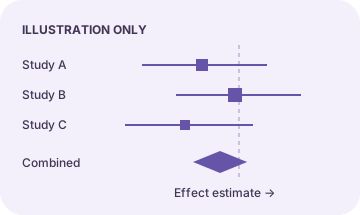
Read the data checks and warnings first. A completed run means the computation finished; it does not establish that the methods or conclusions are appropriate.
- Forest plot
- Each square marks a study estimate; its horizontal line shows a confidence interval. The diamond represents the combined estimate when pooling is appropriate. This illustration is not your result.
- Confidence interval
- Shows uncertainty around an estimate. Read it alongside the effect measure, study quality and the clinical context.
- Heterogeneity
- Variation between study results. Look at the reported heterogeneity measures and consider whether the studies can meaningfully be combined.
For methodology, see the Cochrane Handbook, Chapter 10. This guide explains the software workflow and does not replace statistical review.
Keep your work: download the report, statistical summary, results package and saved settings. The package includes additional plots and checks; execution logs and technical diagnostics stay with the administrator. Download before your analysis expires.
Compare a different choice: choose “Try again with different settings”. The original remains unchanged, and submitting the new run uses another analysis from your allowance or a paid credit.